Best Data Observability Tools (with RFP Template)

Table of Contents
Data observability has been one of the hottest emerging data engineering technologies the last several years. And with LLMs taking the world by storm, data + AI observability has become a natural evolution of the category.
Benefits of data + AI observability include:
- Increasing data trust and adoption
- Mitigating the risks of bad data + AI
- Boosting revenue and data product ROI
- And reducing time and resource costs associated with data quality
In this post, we will share the core evaluation criteria we see organizations use most frequently when ranking data observability or data + AI observability solutions. We’ll also provide a sample RFP template.
Table of Contents
What are data + AI observability tools? And why do they matter?
Data + AI observability refers to an organization’s comprehensive understanding of the health and performance of the core components of their data + AI products.
Data + AI observability combines data quality monitoring with accelerated root cause analysis capabilities. This enables organizations to correlate data + AI reliabliity issues to their corresponding root cause across data, systems, code, and model. In other words, WHY did the issue occur? For example:
- DATA – what source sent us bad data?
- SYSTEM – what specific job failed?
- CODE – what code change led to the anomaly?
- MODEL – was the model output fit for use?
The purpose of data + AI observability tools is to reduce data + AI downtime by automating or accelerating the detection, management, and resolution of data quality issues. Features like the Troubleshooting Agent in the video below can reduce the time to resolve an incident from 18 hours to mere minutes.
Gartner identifies five key workflows these types of solutions should support to accomplish this purpose:
- Monitor and detect
- Alert and triage
- Investigate
- Recommend
- Resolve and prevent
These workflows–we call them detect, triage, resolve, measure–are helpful categories for evaluating key requirements for data + AI observability tools.
The RFP guide later in this document will dive into capabilities across each, but first, let’s look at some high-level criteria that impact the value a data + AI observability tool can provide.
Key features of data observability tools: the analyst perspective
Let’s take a look at what some key industry analysts have pointed to as key evaluation criteria for data observability tools (and by extension data + AI observability tools).
Gartner
While Gartner hasn’t produced a data observability magic quadrant or report ranking data observability vendors, they have named it one of the hottest emerging technologies, you can find peer reviews on their site, and they have produced a Market Guide for Data Observability Tools (which you can access at no cost here)
They say data and analytics leaders should, “Explore the data observability tools available in the market by investigating their features, upfront setup, deployment models and possible constraints. Also consider how it fits to overall data ecosystems and how it interoperates with the existing tools.”
As Gartner sees it, data observability has several critical features, each with the express goal of helping data teams “resolve and prevent” data quality issues:
- Monitor and detect: (What went wrong?)
- Alert and triage: (Who should be notified and when?)
- Investigate: (Why did it happen and what’s the impact?)
Gartner goes on to explain that some data observability solutions will also go one step further by even recommending solutions to answer the ultimate question: “How can this be fixed?”
As they describe it, “[some] issues are critical and require immediate solutions” and specific vendors will extend their value by leveraging root cause analysis tools to provide tangible recommendations to fix those problems, although “Only vendors with advanced technologies offer this feature in their data observability tools… This is a differentiating factor among vendors.”

Forrester
Forrester’s Total Economic Impact of Data + AI Observability report found a ROI of 357% with a payback period of less than 6 months.
The report states:
“For organizations to react to data quality issues as they arise is no longer sufficient. Augmented data quality solutions empower organizations to take proactive measures and prevent data quality problems at the point of ingestion.
Real-time data profiling, data validation, and data monitoring capabilities detect anomalies before they impact operations. These capabilities ensure data conformity to predefined quality and compliance standards while providing continuous monitoring of mission-critical data.
Data + AI observability takes proactive data quality to the next level by helping organizations understand data health and performance. It enables organizations to gain confidence in the integrity, accuracy, completeness, and reliability of their data + AI systems; identify areas for improvement; refine their strategies; and drive operational excellence”.
The five quantified value drivers discussed in the report include:
- Avoided losses from data + AI downtime
- Reclaimed hours from data personnel
- Improved efficacy of AI/ML models
- Improved collaboration from data trust
- Savings from data cloud storage and compute costs
G2 Crowd
G2 was one of the earliest non-vendor resources to put together a credible list of data observability vendors and a definition for the category. They say:
To qualify for inclusion in the G2 Crowd data observability category, a product must:
- Proactively monitor, alert, track, log, compare, and analyze data for any errors or issues across the entire data stack
- Monitor data at rest and data in motion, and does not require data extraction from current storage location
- Connect to an existing stack without any need to write code or modify data pipelines
Vendors are evaluated by verified users of the product across a list of organizational and product specific capabilities including:
- Quality of support
- Ease of admin
- Ease of use
- Integrations
- Alerting
- Monitoring
- Product direction
- Automation
- Single pane view
Key features of data + AI observability tools: our perspective
Here are the key evaluation criteria we feel are the most critical to a comprehensive and future-proof data + AI observability solution:
- Enterprise-grade scalability & security
- Immediate time to value
- End-to-end visibility
- AI-Powered workflows
- Intelligent, fast root-cause analysis
- Right time, right channel alerting
- Operational reporting
- Agent observability
So, now that we’ve got those points in mind, let’s dive into each of these criteria in a bit more detail.
Enteprise-grade scalability & security
The world of data + AI is always evolving. That’s why you need a data + AI observability provider that can serve as a strategic advisor.
Any vendors can promise the world, but can they deliver? Will they be around in a year? These are important questions to answer through customer reference calls to understand a solution’s overall maturity.
Some key areas to evaluate for enterprise readiness include:
- Security– Do they have SOC II certification? Robust role based access controls?
- Architecture– Do they have multiple deployment options for the level of control over the connection? How does it impact data warehouse/lakehouse performance?
- Usability– Is an alert just pretty or will it actually save you time—like bulk update incidents or being able to deploy monitors-as-code. Usability can also be subjective in a POC, so it’s important to balance this with perspective from actual users.
- Scalability– What are their largest deployments? Has this organization proven its ability to grow alongside its customers? Other key features here include things like ability to support domains, reporting, change logging, and more.
- Support– Data + AI observability isn’t just a technology, it’s an operational process. The maturity of the vendor’s customer success organization can impact your own level of success as can support SLAs (if the vendor doesn’t have support SLAs, that’s a red flag).
- Innovation history and roadmap– The data world changes rapidly and as we enter the AI era, you need a partner that has a history of first-to-market innovation. Fast followers are often anything but, with comparative features shipped 6 months to a year later. (That’s 25 in chief data officer years.) Cloud-native solutions often have an advantage here.
Immediate Time To Value
Data + AI observability is intended to reduce work—not to add more.
If a data + AI observability tool is providing the right integrations and automated monitors for your environment out-of-the-box, it will be quick to implement and deliver near-immediate time-to-value.
A data + AI observability solution that requires more than a few hours to set up and more than a couple of days to start delivering meaningful alerts is unlikely to deliver the data quality efficiencies that an enterprise will require to scale data + AI reliability long-term.
Not only should the solution be quick to set up and its monitors quick to train, but the ongoing maintenance should be minimal.
Pipelines and business use cases change. It should be easy for users to reconfigure monitoring with those changes–and even have automated anomaly detection with thresholds that automatically update with those changes.
Two additional things to consider:
- Cloud native platforms will generally deliver value more quickly as there is less need to manage infrastructure for monitoring jobs.
- Pricing model matters. Consumption based pricing allows for organizations to realize a faster payback (ideally in 6 months or less) on their investment. It is also much easier to pilot, notch a quick win, and scale.
End-to-end visibility
The true power of data + AI observability lies in its ability to integrate across your data + AI estate from production and ingestion to transformation and consumption.
You cannot monitor components in a vacuum because issues in one stage or system cascade into another. For example, building differentiated, useful generative AI applications requires first-party data.
Most data +AI observability solutions today will monitor the data pipelines powering RAG or fine-tuning use cases–they are essentially the same as data pipelines powering other data products such as dashboards, ML applications, or customer facing data.
However, the generative AI ecosystem is evolving rapidly and your data + AI observability vendor needs to be helping to lead the charge. That means support for monitoring vector databases, unstructured data, and more.

AI-Powered Workflows
For years, data testing–whether it was hardcoded, dbt tests, or some other type of unit test–was the primary mechanism to catch bad data.
While still relevant in the right context, the problem with a monitoring strategy that is overreliant on static data testing is teams are unable to anticipate and write a test for every single way data can break.
And even if you could, it would be difficult to scale across the entire data product surface area from the initial land in the bronze or raw layer, through the initial transformations in the metrics or silver layer and into gold.
Data + AI observability tools should have advanced anomaly detection monitors that can be automatically deployed across an entire data product as it evolves and new tables are created.
It is also important for these tools to leverage new approaches like AI agents to accelerate common data quality workflows such as recommending relevant data quality rules for a dataset or troubleshooting incidents by identifying the root cause.

Be sure to verify that your chosen solution offers tooling integrations for each of the layers you’ll need to monitor in order to validate the quality of your data products, as well as integrations into existing workflows with tools like Slack, Microsoft Teams, Jira, and GitHub.
Intelligent, fast root-cause analysis
The average time to identify the root cause and resolve a data quality incident is 19 hours. In that time, bad data is reaching your consumers, AI models, and potentially even your customers and regulators.
That has a real cost and the best way to mitigate this risk is to have a data + AI observability solution automatically correlate the issue to its root cause. This is only possible with integrations and visibility into data, system, code and model.
For example, the data can arrive late or inaccurate straight from the source. Alternatively, bad data can result from a failure in one of the many highly complex and dependent systems involved in the data delivery process (maybe a failed Airflow job).
Another common culprit are changes or mistakes made as part of the data curation or transformation process, often as an update to a dbt model or warehosue query.
And finally, data quality issues can now result from AI models generating outputs that are not fit for purpose.
Be on the lookout for cr0ss-system data lineage, query change detection, job failure correlations, segmentation analysis, troubleshooting AI agents and other root cause analysis features that can help identify these issues and provide the proper context to help your team remediate each at its source.
Right time, right channel alerting
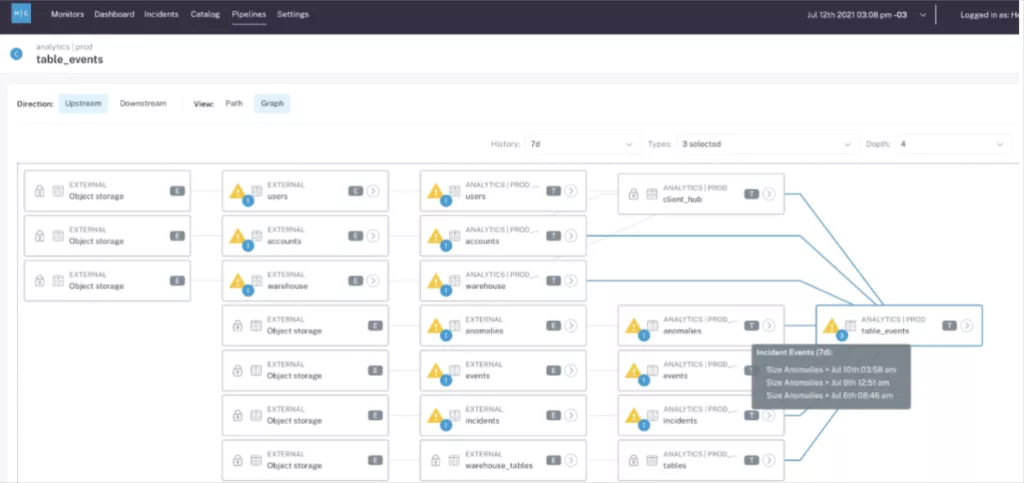
Lineage is a dependency map that allows you to visualize the flow of data through your pipelines and simplify root cause analysis and remediation.
This map allows some data + AI observability tools to understand which alerts are related and which alerts should be routed to which teams. Both of these are critical to reducing alert fatigue and ensuring data + AI teams actually engage with and resolve issues urgently.
For example, alert grouping ensures that when a single incident triggers multiple alerts downstream, a team sees the full story in a single thread rather than getting 12 jumbled chapters that may be part of one story or two.
The ability to route alerts based on the impacted data product, domain, or importance score can also dramatically improve the average time it takes for teams to respond to alerts.
Finally, once the alert gets to the right team they need to understand if it should be prioritized. And how do you do that?
Easy—you look at the impact. Data + AI observability tools should automatically provide teams the context on how important the impacted table is, AND how many and which dashboards have been impacted downstream.
Operational Reporting
Most data teams we talk to initially have a detection focused mind-set as it relates to data quality, likely formed from their experience with data testing.
The beauty of data + AI observability is that not only can you catch more meaningful incidents, but the best solutions will also include features that improve your ability to proactively communicate the reliability of data assets and your team’s operational response to issues. THERE IS NO MORE RELIABLE WAY TO CREATE DATA TRUST.
Key requirements include:
- Integrations with a data catalog for surfacing the current health of assets.
- Use case-specific data quality scores
- Dashboards for tracking the number and severity of incidents as well as the average time to respond and resolve.
Agent observability
Building valuable generative AI or agent applications requires reliable first party data. Many agents are designed to query the data warehouse or lakehouse to get the context they need–if the data isn’t reliable and accurate they will appear to hallucinate.
But even with perfectly accurate context, agents can still produce outputs unfit for use. It could be a missing citation, wrong tone of voice, or a simple but devastating hallucination.
Data + AI observability tools need to be able to monitor AI outputs using both LLM-as-judge and deterministic monitors along with features allow monitoring to scale in production such as data sampling, trace debugging, span filtering and more.
Data + AI Observability RFP Template
Not every data team needs to issue a RFP or undergo a proof of concept. But some organizations find it helpful to organize their evaluations this way. This template is inspired by RFPs we have seen from customers and is an amalgamation of the very best.
| Data + AI Observability Request for Proposal | |
| Section | Criteria |
| Company Background | What is your experience in the industry? What references and case studies can you provide from similar projects? |
| What is your vision for the future of data + AI observability? | |
| How doyou leverage AI in your product to automate/accelerate data quality workflows? | |
| What are your planned enhancements and new features in the next quarter? | |
| Security | Is your product delivered as a Software-as-a-service (SaaS) offering? |
| Can you deploy the agent in our AWS/GCP/Azure instance if desired? | |
| Can you provide proof of SOC2 Type II certification? | |
| What options do you provide for authentication? | |
| Do you have role based access controls? | |
| Do you provide an API for retrieving security events to import into a SIEM? | |
| Are third-party penetration tests available? | |
| Is PII filtering available? | |
| What data is exported from our environment? Is it encrypted? | |
| Configuration and Management | What functionality is available via API? |
| Can monitors be created via API? | |
| Can audiences be created and configured via API? | |
| Is a command line interface available to simplify API interactions? | |
| Are any SDKs available, e.g. for use in Python scripts or Data Science Notebooks? | |
| Can monitoring and alerting be configured from within your Airflow jobs, without breaking a workflow? | |
| Can monitoring be defined in YAML? | |
| Can alert routing and audiences be defined in YAML? | |
| How will your product impact our data warehouse/lake/lakehouse performance and compute costs? | |
| Integrations | What cloud native data warehouse technologies does your platform integrate with? |
| What cloud native data lakehouse technologies does your platform integrate with? | |
| What other database technologies does your platform integrate with? Does that include vector databases? | |
| What query engines and metastores does your platform integrate with? | |
| What ETL technologies does your platform integrate with? | |
| What catalog technologies does your platform integrate with? | |
| What BI technologies does your platform integrate with? | |
| What collaboration channels does your platform integrate with? | |
| Support & CS | Do you provide web-based self-support resources? |
| What is your support SLA? | |
| Are your releases backwards compatible? | |
| Do you charge additional fees for providing product support? | |
| What training, onboarding, and ongoing support is available? | |
| Pricing Structure | What is the basis of licenses for the product? |
| Is on-demand/usage based pricing available? | |
| AI-Powered Monitoring | What kinds of intelligent features are implemented that allow for finding anomalies without the need for manual input? |
| Can anomaly detection be automated to cover tables upon creation based on schema, database, domain, tag, and table name? | |
| Does the platform leverage AI to understand data profiles, metadata, and logs to define and recommend relevant monitoring? | |
| Are specific anomaly detection models applied based on the specific table pattern type classification (I.E streaming_table / weekend_pattern / multimodal_update_pattern / etc.)? | |
| Approximately how many production tables are your ML monitors deployed across currently? | |
| Are there mechanisms for adjusting the sensitivity of the anomaly detection models? | |
| Can exclusion windows be set for anomaly detection models to ignore expected weird or seasonal data patterns? | |
| Can the product monitor unstructured data with both built-in and customizable quality metrics? | |
| Can machine learning anomaly detection monitors be deployed on specific segments of a table for one or multiple metrics? | |
| Can machine learning anomaly detection monitors be adjusted to detect anomalies based on hourly, daily, or all record aggregations? | |
| Can machine learning anomaly detection monitors be deployed without code for multiple variables (condition X AND condition Y = true)? | |
| Can machine learning anomaly detection monitors be scheduled? | |
| Can machine learning anomaly detection monitors be set to execute whenever a table is updated? | |
| Are failure notifications sent when a monitor fails to execute successfully? | |
| Can monitoring cost be allocated to specified query engines within the same warehouse? | |
| Are machine learning monitor configurations automatically recommended by the platform? | |
| Does the monitor creation process mandate a name and description? | |
| Does the product provide machine learning anomaly detection models to detect data freshness anomalies? | |
| Does the product provide machine learning anomaly detection models to determine when the number of rows added to a table are too high or low based on historical patterns? | |
| Does the product provide machine learning anomaly detection models to determine table unchanged size anomalies? | |
| Can volume anomaly detection be run on external views or tables? | |
| Can custom anomaly detection monitors be built to monitor custom metrics with automatically set and updated thresholds? | |
| Does the product automatically provide schema change detection (column name, data type) for selected datasets? | |
| Does the product allow users monitor nested JSON within a given field in a table? | |
| Does the product provide machine learning anomaly detection for NULLs or missing values? | |
| Does the product provide machine learning anomaly detection for percentage of unique values in a field? | |
| Does the product provide machine learning anomaly detection for distribution using metrics such as min, max, average, stddev, variance, skew, percentiles? | |
| Does the product provide machine learning anomaly detection to alert when a column receives new values or an anomalous distribution of values in a column? | |
| Does the product provide machine learning anomaly detection for validation such as detecting when is an anomaly in the number of values within a column that are not in a standard format such as email, social security number, US state code, and more? | |
| Does the product provide machine learning anomaly detection for timestamp fields including detecting anomalies when the percentage of values in a field are in the future or past? | |
| Data Validation & Rules | Does the platform offer pre-built data validations or rule templates where thresholds be be defined and deployed without code? |
| Can custom data validations and rules with manually defined thresholds be created and deployed with SQL? | |
| Can data validations and rules be tested prior to deployment? | |
| Can complex data validations, with alert conditions featuring multiple variables, be created and deployed without code? | |
| Can data validations and rules be executed based on a schedule or manual trigger option? | |
| Can value-based thresholds be set to return a single numerical value when a specific column drops below a given value? | |
| Can data quality rules be deployed that compare values across tables? | |
| Does the platform offer the ability to identify records or key fields that are present in one dataset but missing in another? (referential integrity) | |
| Can data quality rules be deployed that compare values across database, warehouse, or lakehouse? (source to target checks) | |
| Can custom SQL rules be generated with AI from within the platform? | |
| Does the tool have feature of circuit breaker which can stop the pipelines when data does not meet a set of quality or integrity thresholds? | |
| Does the platform offer the ability to profile a table interactively and without code? | |
| Does the platform leverage AI to understand data profiles, metadata, and logs to define and recommend relevant monitoring? | |
| Assets & Metadata Consolidation | What types of data assets are discoverable within the platform? |
| Are different table types–such as views, external tables, wildcard tables, dynamic tables–discoverable within the platform? | |
| Are non-table assets such as BI reports, orchestration jobs, and streams discoverable within the platform? | |
| What general information and metadata is listed within each asset? | |
| Are tags from other data systems, such as the data warehouse or ETL tools, surfaced and inherited within the platform? | |
| Are usage statistics of each table including read/writes a day, number of users, latest updates, and number of dependencies automatically discovered and surfaced within the platform? | |
| Is the schema, table type, and database name surfaced for each asset? | |
| Is field level lineage surfaced for each asset? | |
| Is table level lineage surfaced for each asset? | |
| Does the platform’s data lineage show ingestion, orchestration, and transformation workflows between lineage nodes? | |
| Does the platform surface the type and execution history for monitors on a specific asset? | |
| Are the number of downstream reports, and overall upstream and downstream dependencies, surfaced for each asset? | |
| Is the historical update cadence, including time since last row count change, for each asset surfaced? | |
| Is the row count history surfaced for each asset? | |
| Are the associated query logs for each asset surfaced? | |
| Is the performance of ETL systems acting on that specific asset surfaced? | |
| Alerting & Notifications | Can alerts be muted? |
| Can notifications for rule breaches that stay violated be adjusted to alert every time, after a certain number of runs, or only if the count of breached rows change? | |
| What alert channels are supported? | |
| How are alerts routed to specific channels and audiences? | |
| Can alerts be routed to specific channels based on alert type, domain, asset importance, tag, table name, or dataset? | |
| Can alerts be sent in real-time or in a daily digest? | |
| Can alert notifications have pre-set priority levels? | |
| Can alert notifications have pre-set descriptions, including the ability to tag specific owners or teams? | |
| What kind of guidance or initial information do system alerts provide? | |
| For breached data validations or rules, is the description of the validation, number of breached rows, and last breach date information provided within the alert notification? | |
| Do alert notifications indicate the importance of an asset for quick prioritization and triage? | |
| Are triggered alerts with the same dependencies (cascading incidents) automatically grouped together within the same thread to improve management and avoid fatigue? | |
| How is ownership of incidents and data assets tracked within the platform? | |
| Can the product automatically infer the priority of a detected issue by factors such as table popularity and consumption at the repository and BI layers? | |
| Are system alerts from ETL tools ingested and consolidated within the platform? | |
| Incident Management | Do alerts feature information on the specific downstream reports impacted (automatic impact analysis)? |
| Can alerts be escalated to incidents with different severity levels within the platform? | |
| Can alert/incident status be assigned and changed within the platform? | |
| What workflows and feeds exist for managing alert/incidents within the platform? | |
| Can alerts be filtered by status, type, severity, tag, owner, table, schema, database, or audience? | |
| What service/ticket management/workflow integrations exist for managing incidents outside of the platform? | |
| Is the history of data incidents or failed checks on an asset accessible? | |
| Can those incidents be annotated with custom notes? | |
| What data catalog integrations are available? | |
| How can data consumers be proactively alerted to incidents or the current health status of a dataset? | |
| Resolution/Root Cause Analysis | Does the tool detect insights to facilitate in the discovery of the root cause of a particular data incident? Does the tool use AI to accelerate root cause analysis and troubleshooting? |
| Does the platform provide segmentation analysis to automatically identify patterns within anomalous records. For example, if a spike in NULLS correlates to values of invoice_status=pending. | |
| Does the platform provide users automated suggestions for investigation queries based on how their team researched breaches of that rule in the past. | |
| Does the product integrate with multi-system data lineage with anomaly detection to help users pinpoint the origin of an incident? | |
| For machine learning monitors, does the product automatically provide samples of anomalous records? | |
| For data validations, does the product automatically provide samples of breached rows? | |
| Does the product automatically surface system integration failures due to permissioning or credentialing issues? | |
| Does the product leverage metadata to automatically surface job failure alerts from ETL and orchestration systems? | |
| Does the product leverage metadata to surface the performance of orchestration jobs acting on specific assets to provide additional insight for troubleshooting? | |
| Does the product automatically correlate data anomalies to relevant system failures to accelerate root cause analysis? | |
| Does the platform surface the query logs of specific assets to provide additional insight for troubleshooting? | |
| Does the platform automatically correlate anomalies to relevant changes in the query code of the underlying or upstream asset? | |
| Does the platform leverage metadata to correlate anomalies to failed queries? | |
| Does the platform leverage metadata to correlate anomalies to empty queries–queries that executed successfully but did not update or modify any data? | |
| Does the platform provide a unified incident timeline and systems performance dashboard to enable users to accelerate their root cause analysis? | |
| Does the platform correlate data anomalies to relevant pull requests (PRs) on relevant assets? | |
| Can the platform help prevent incidents by automatically surfacing the impact of a schema change on downstream assets during the pull request process? | |
| Reporting | Does the product automatically compile alert and incident metrics–including status, severity– at the domain, dataset, audience, and data product levels? |
| Does the product contain prebuilt dashboards that compile operational response metrics–including time to response and time to fixed– at the domain, dataset, audience, and data product levels? | |
| Does the product contain prebuilt dashboards that automatically surface the data health– number of breached data validations and custom rules–of specific tables? | |
| Does the product contain prebuilt dashboards that contain all incident metrics, data health, and operational response metrics across all the tables within a selected dataset (data product pipeline)? | |
| Can metrics be easily exported via API? | |
| Agent Observability | Can the platform monitor for quality/reliability issues across both data and AI outputs? Within the same interface? |
| Is telemetry for agent operations (e.g. prompts, context, completions, duration, tokens) captured and structured based on industry standards? What LLM models and frameworks are supported? | |
| Can monitors be deployed at the trace (run) and span levels? | |
| Can monitors be deployed to inference tables already created within the warehouse or lakehouse? | |
| Can anomalies or silent regressions in agent behavior be automatically detected (via anomaly detection) without manual threshold tuning? | |
| Can anomalies or regressions in agent operational metrics (cost, latency, etc) be monitored? Can they be automatically detected (via anomaly detection) without manual threshold tuning? | |
| Does the platform provide pre-built LLM-as-Judge evaluation monitors (or “checks”) to assess agent output quality (e.g. relevance, prompt adherence, clarity, task completion)? Can they be easily customized? | |
| Can users define custom criteria and evaluation monitors? | |
| Can users evaluate the effectinvess of their monitors (custom or otherwise) by testing them on historical traces? | |
| Can the system support sampling strategies (e.g. stratified sampling of outputs) to scale monitoring across large volumes of agent runs? | |
| Can criteria be selected to filter spans for monitoring (e.g. only monitor spans over a certain duration?) | |
| Can evaluations be set to monitor specific segments? (e.g. monitor for relevancy anomalies by model type?) | |
| Can telemetry remain within the our own data infrastructure (warehouse, lakehouse, or lake) to maintain compliance, governance, and audibility? | |
| Does the observability solution support role-based access control so that only authorized users can view sensitive traces or telemetry? | |
| Does the platform support integration with existing communication tools (Slack, Microsoft Teams, email) and incident management tools (e.g., PagerDuty, ServiceNow, Jira) for alert routing? | |
| Do evaluations provide a change log and run history? | |
| Does the platform provide pre-built SQL evaluation monitors (or “checks”) to assess agent output quality (e.g. output length, format, banned words, etc.)? Can they be easily customized? | |
What’s the future of data + AI observability tools?
There’s one critical feature that we didn’t mention earlier, that plays a huge role in the long-term viability of a data + AI observability solution.
And that’s category leadership.
Like any piece of enterprise software, you aren’t just making a decision for the here and now—you’re making a bet on the future as well. When you choose a data + AI observability solution, you’re making a statement about the vision of that company and how closely it aligns to your own long-term goals.
“Will this partner make the right decisions to continue to provide my organization with adequate data quality coverage in the future?” Particularly as AI proliferates, having a solution that will innovate when and how you need it is equally as important as what that platform offers today.
Monte Carlo been named a proven category leader by the likes of G2, Gartner, ISG, and the industry at large; and has also become the de facto leader for AI reliability as well.
There’s no question that AI is a data product. And with a mission to power data quality for your most critical data products, Monte Carlo is committed to helping you deliver the most reliable and valuable AI products for your stakeholders.
Ready to find out how the category leader in data quality and data observability tools can help you get the most out of your data and AI products? Let’s talk!
Our promise: we will show you the product.


