Data Quality Monitoring Explained – You’re Doing It Wrong

Table of Contents
The argument goes something like: “You may have hundreds or thousands of tables in your environment, but only a few really matter. That’s where you really want to focus your data quality monitoring.”
And it’s true – you need to go “deep” on certain data sets; but if you’re not monitoring broadly as well, you’re missing the boat—and a whole lot of bad data.
As your data environment grows increasingly complex and interconnected, the need to cover more bases, faster, becomes critical to achieving true data reliability. To do this, you need data monitors that drill “deep” into the data using both machine learning and user-defined rules, as well as metadata monitors to scale “broadly” across every production table in your environment and to be fully integrated across your stack.
In this post we’ll explain why – and how – delivering reliable data requires layering multiple types of data monitors across the field, table, enterprise data warehouse, and stack levels.
Table of Contents
What is data quality monitoring?
Data quality monitoring is the process of automatically monitoring the health of data pipelines and the data that runs through them. Unlike data testing, which is a point solution designed to detect specific known issues (like null rates or bad string patters), data quality monitoring is an ongoing solution that continually monitors and identifies unknown anomalies lurking in your data through either manual threshold setting or machine learning.
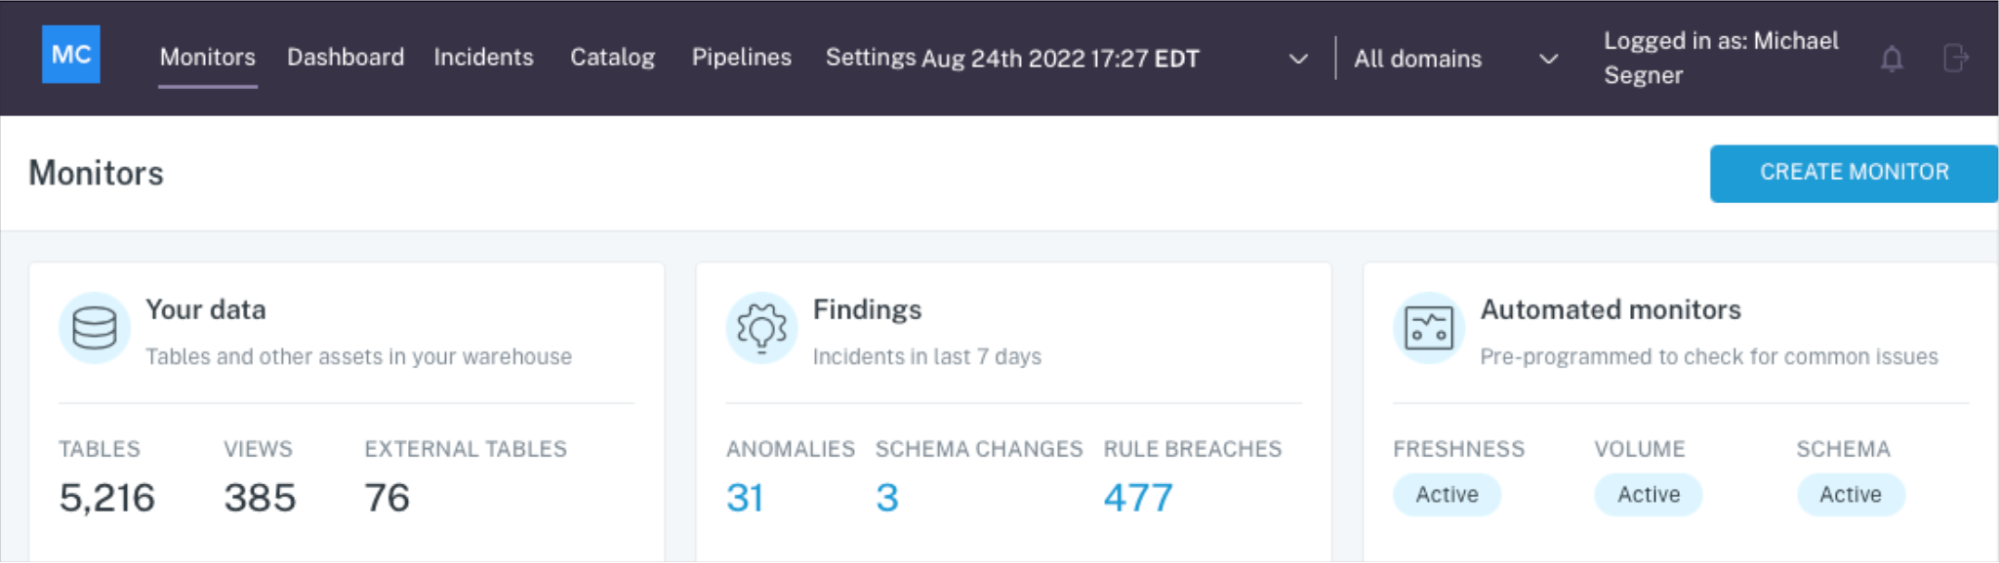
What good monitoring actually checks
- Freshness (timeliness): Is the table or feature arriving on schedule?
- Volume/completeness: Are row counts within expected ranges?
- Schema changes: Did columns, types, or constraints change unexpectedly?
- Field/metric health: Nulls, duplicates, out‑of‑range values, distribution shifts.
Traditional data quality monitoring practices
While traditional data quality monitoring is a more efficient solution than something like a dbt unit test to detect unknown issues in active pipelines, it can also be quite taxing on engineering hours and compute time. For this reason, we’ll frequently talk with data teams interested in applying data quality monitoring narrowly across only a specific set of key tables.
And of course, there’s value to paying special attention to your “golden tables.” So, before we look at some of the current evolutions of data quality monitoring, let’s, consider how “deep data quality monitoring” might be used in a modern enterprise data environment.
Deep data quality monitoring at the field level
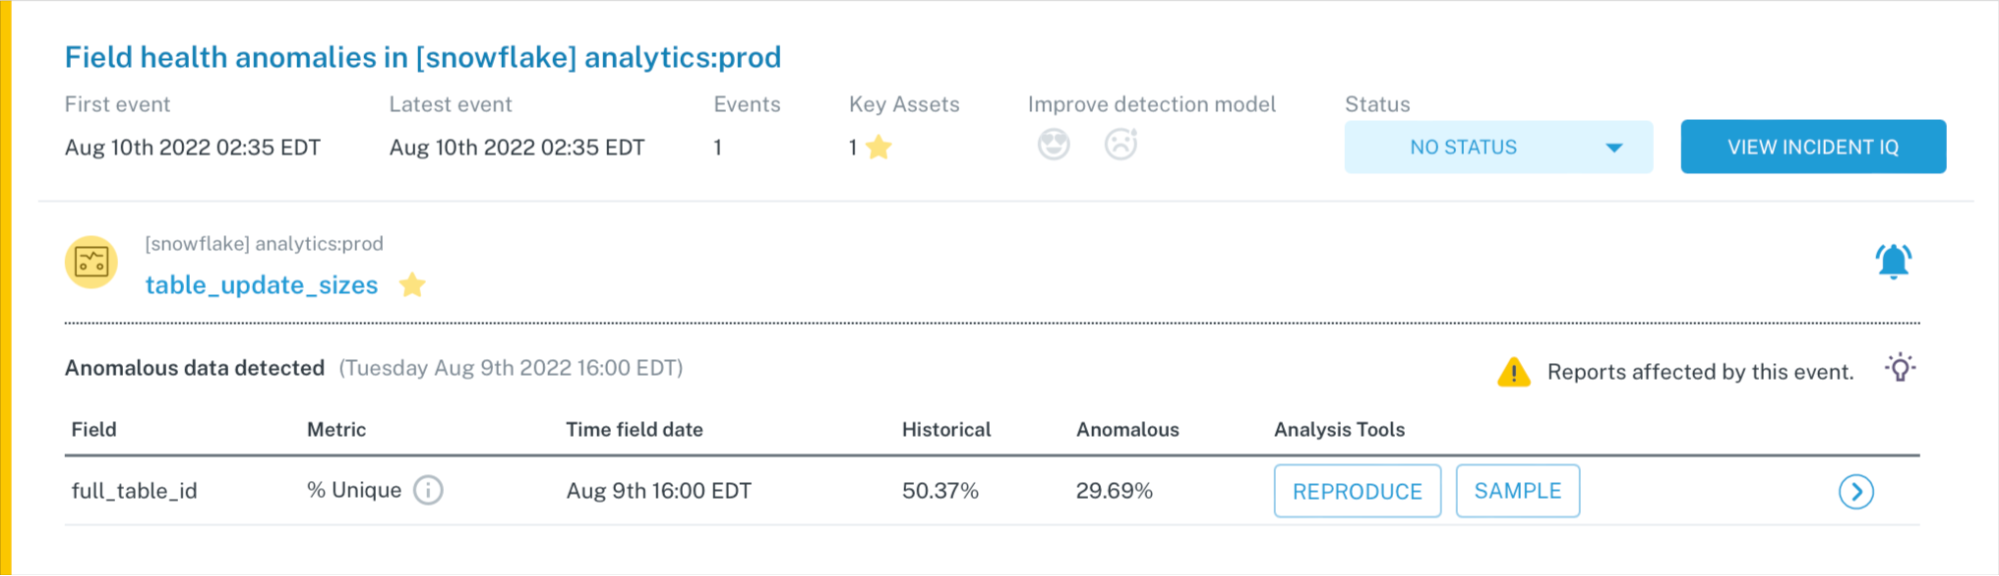
The first type of “deep” data monitors you need use machine learning to generate pre-configured data quality rules to validate the data in your tables. These are best deployed when you know a set of fields in a particular table is important, but you aren’t sure how it will break. Such data monitors are effective at detecting anomalies that occur when individual values in a field are null, duplicated, malformatted or otherwise broken. It can also identify cases when metrics deviate from their normal patterns.
You don’t need to pre-configure rules and thresholds for these types of monitors – most data quality monitoring solutions will offer suggestions based on historical trends in the data. However, because you’re querying the data, it is compute intensive. This makes it prohibitively expensive to scale throughout full pipelines, making them best suited for “going deep” on your high risk tables.
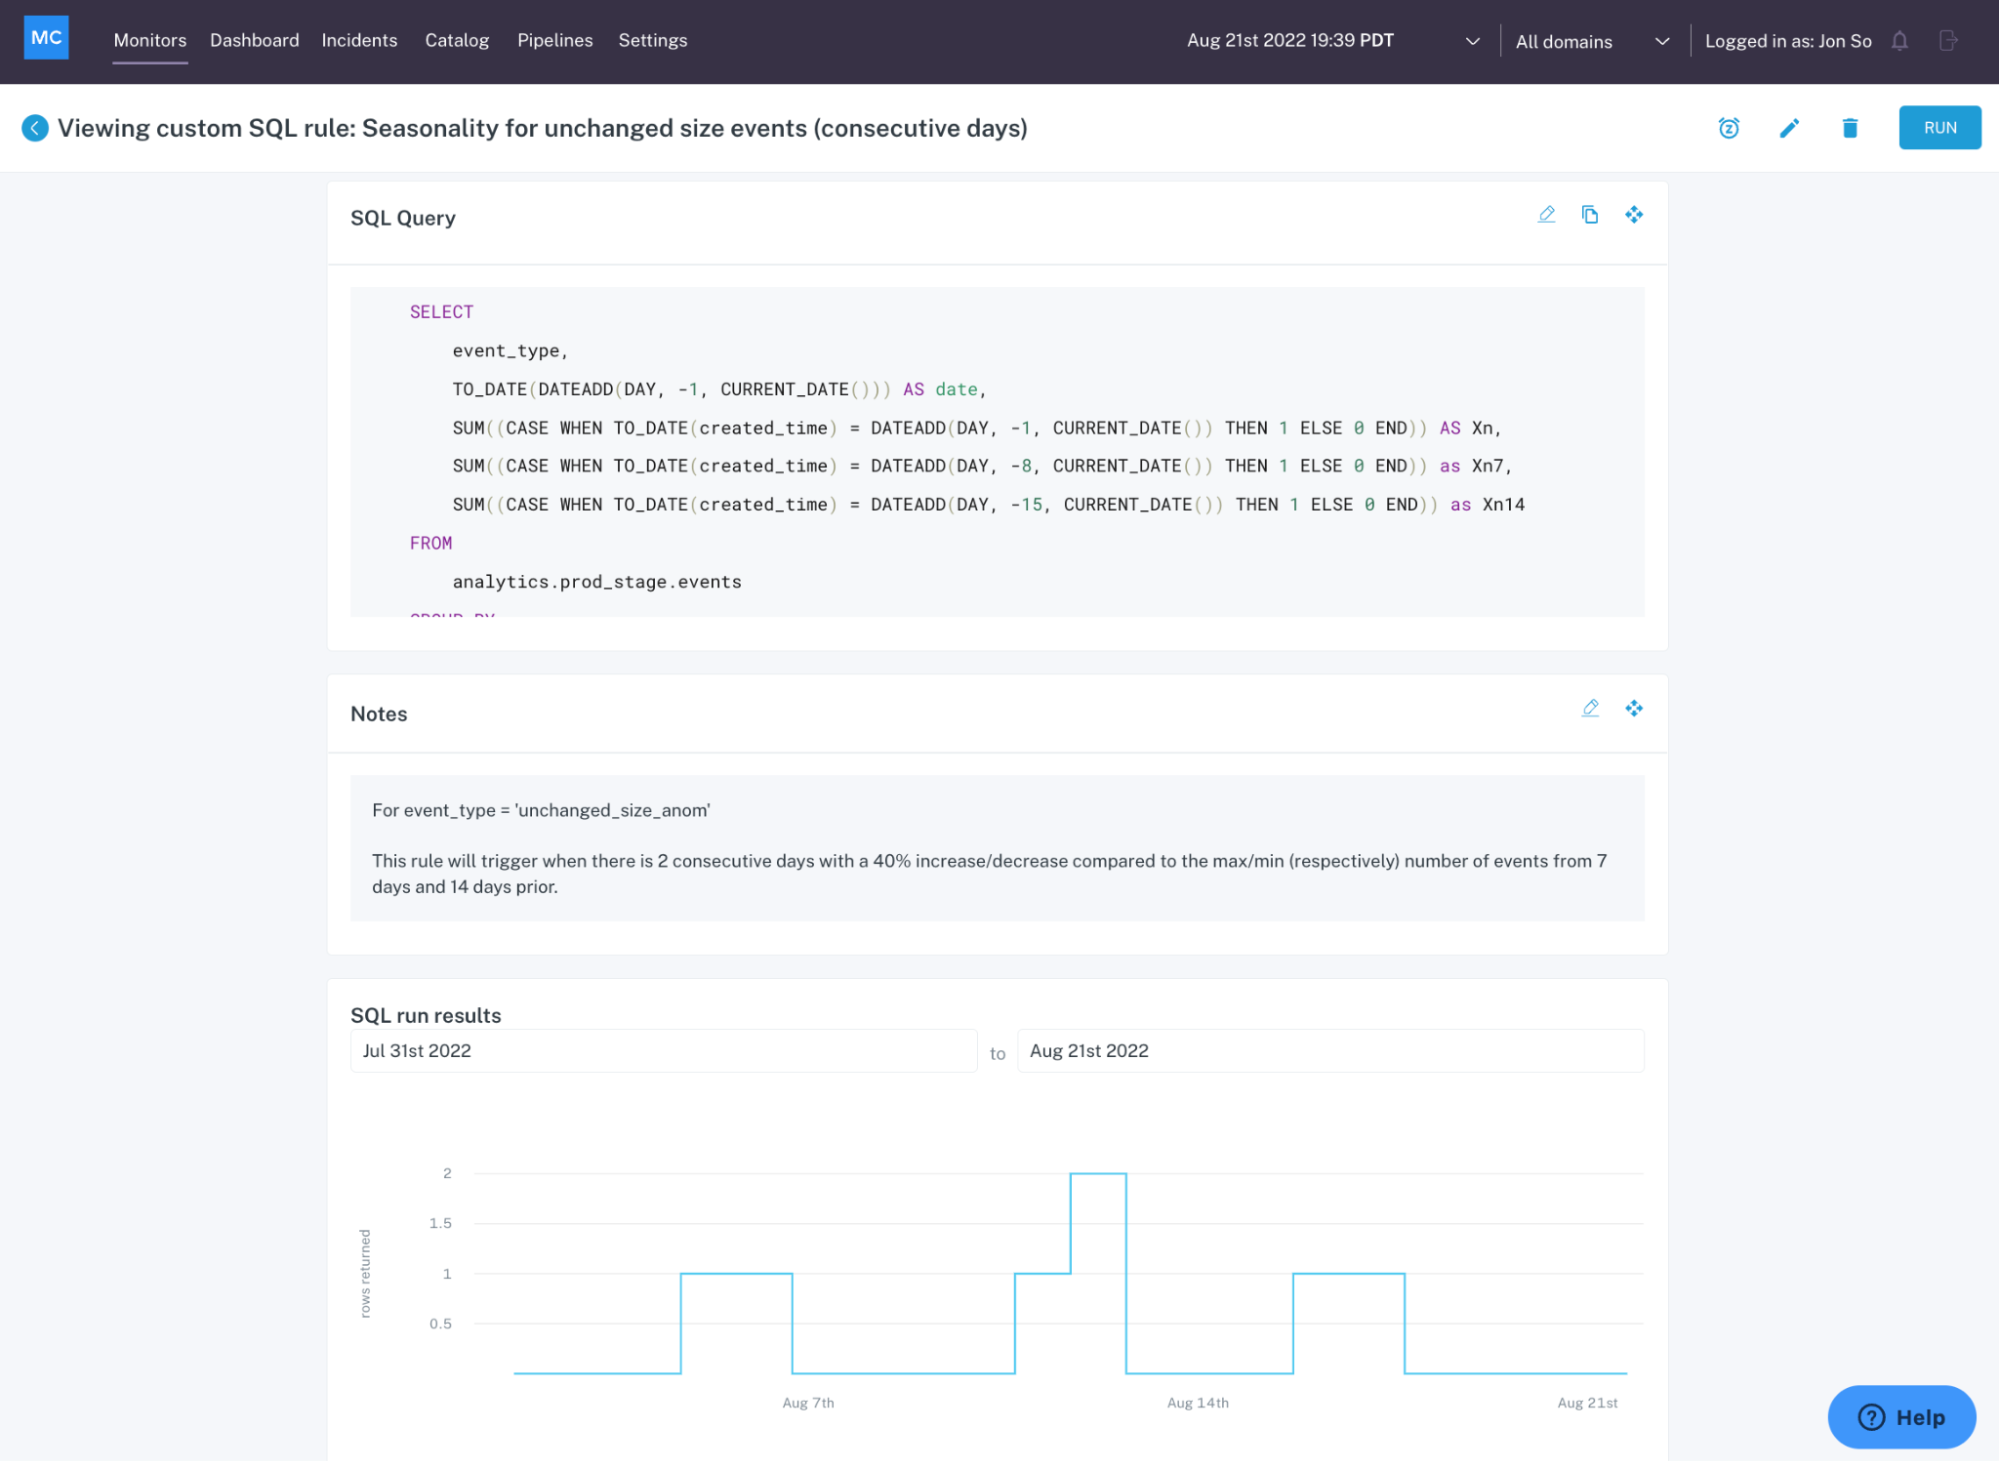
The second type of monitors, user-defined monitors trigger an alert when the data fails specified logic. User-defined, machine learning-powered data quality monitors are best deployed using the most well-defined, understood logic to catch anomalies that are frequent or severe. It is typically expressed through a SQL statement.
In other words, these data monitors track data accuracy, data completeness, and general adherence to your business rules. For example, you may have a metric like shipment time that can never be negative or null, or a field in a critical table that can never exceed 100 percent. It can even help track whether data stored in one table matches data stored in another table, or whether your metrics are consistent across multiple breakdowns and calculations.
Deep data quality monitoring at the table level
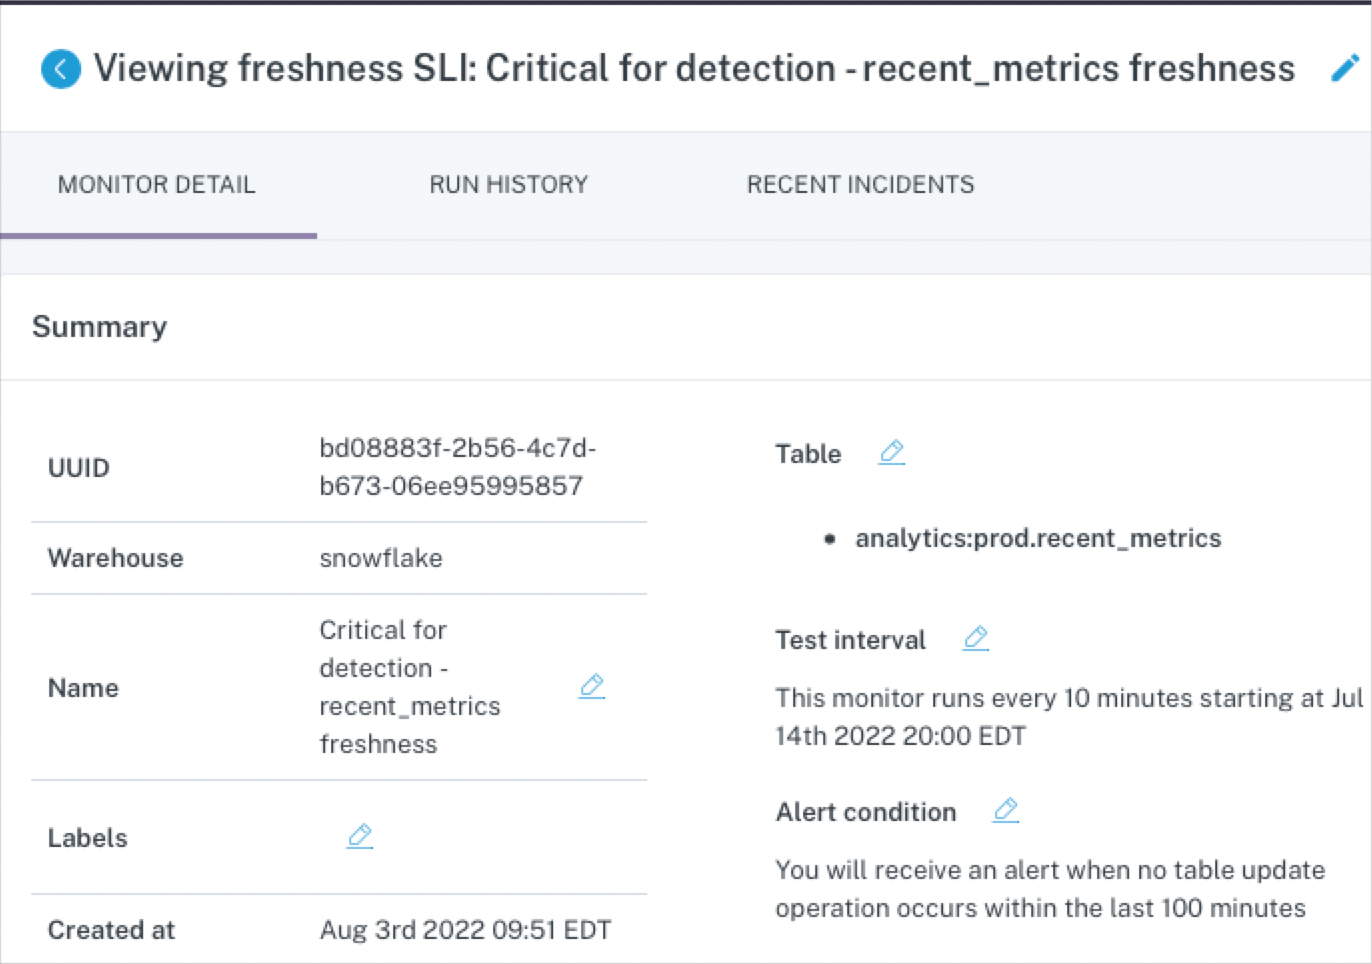
At the table level, ML-based data monitors can detect anomalies like freshness (did that table update when it should have?) and volume (are there too many or too few rows?).
But again, this approach is too costly to deploy at scale across all of your pipelines, making these data quality monitors best reserved for a few critical assets. For example, if your CEO looks at a specific dashboard every morning at 8:00 am EST and heads will roll if the data feeding that report hasn’t been updated by then.
The limitations of narrow and deep data quality monitoring
When you only deploy user-defined and machine learning monitors on your most important tables:
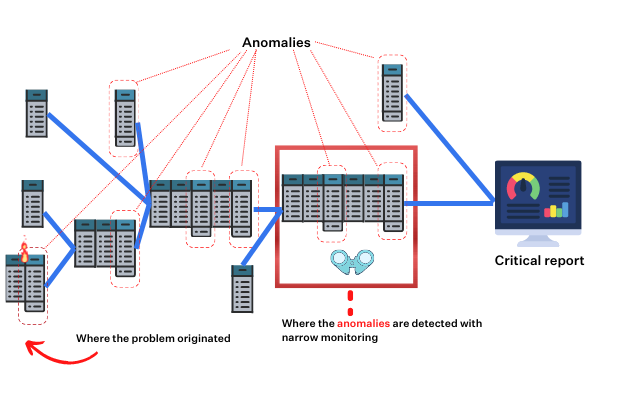
- You miss or are delayed in detecting and resolving anomalies more evident upstream.
- Alerting on a key table, oftentimes dozens of processing steps removed from the root cause, will involve the wrong person and give them little context on the source of the issue or how to solve it.
- Without understanding the dependencies in the system, your team will waste time trying to determine where to focus their monitoring attention. Maintaining that as the environment and data consumption patterns change can also be tedious and error prone.
Why you need broad metadata monitoring across the enterprise data warehouse
“Broad” metadata monitors is a cost-effective solution to scale data quality monitoring coverage across your environment.
Unlike traditional monitoring which will need to be coded, these are available out-of-the-box through Data + AI Observability—a modern data quality solution that combines testing and monitoring for faster detection with lineage and incident management features for faster resolution as well. And because they avoid querying the data directly, they keep compute cost low relative to traditional data quality methods, without sacrificing efficacy.
These broad monitors are highly effective at detecting freshness and volume anomalies across your end-to-end environment, as well as anomalies resulting from schema changes (did the way the data is organized change?).
By casting a wider net, you’re not only catching all impactful anomalies, you are also reducing time to detection and resolution by catching them closer to the source of an incident. It’s time and resource expensive to trace anomalies back several layers and people upstream, conduct the necessary backfills, and otherwise resolve the incident.
Broad ML-based meta-data monitoring paired with well-trained models, dynamic alert grouping, and granular alert routing ensure alert fatigue doesn’t become an issue.
End-to-end integration and log analysis across the stack
Like we mentioned briefly above, broad coverage also entails end-to-end integration. Without analyzing the logs across each component of your stack, you are blind to how changes in one system may be causing anomalies in another.
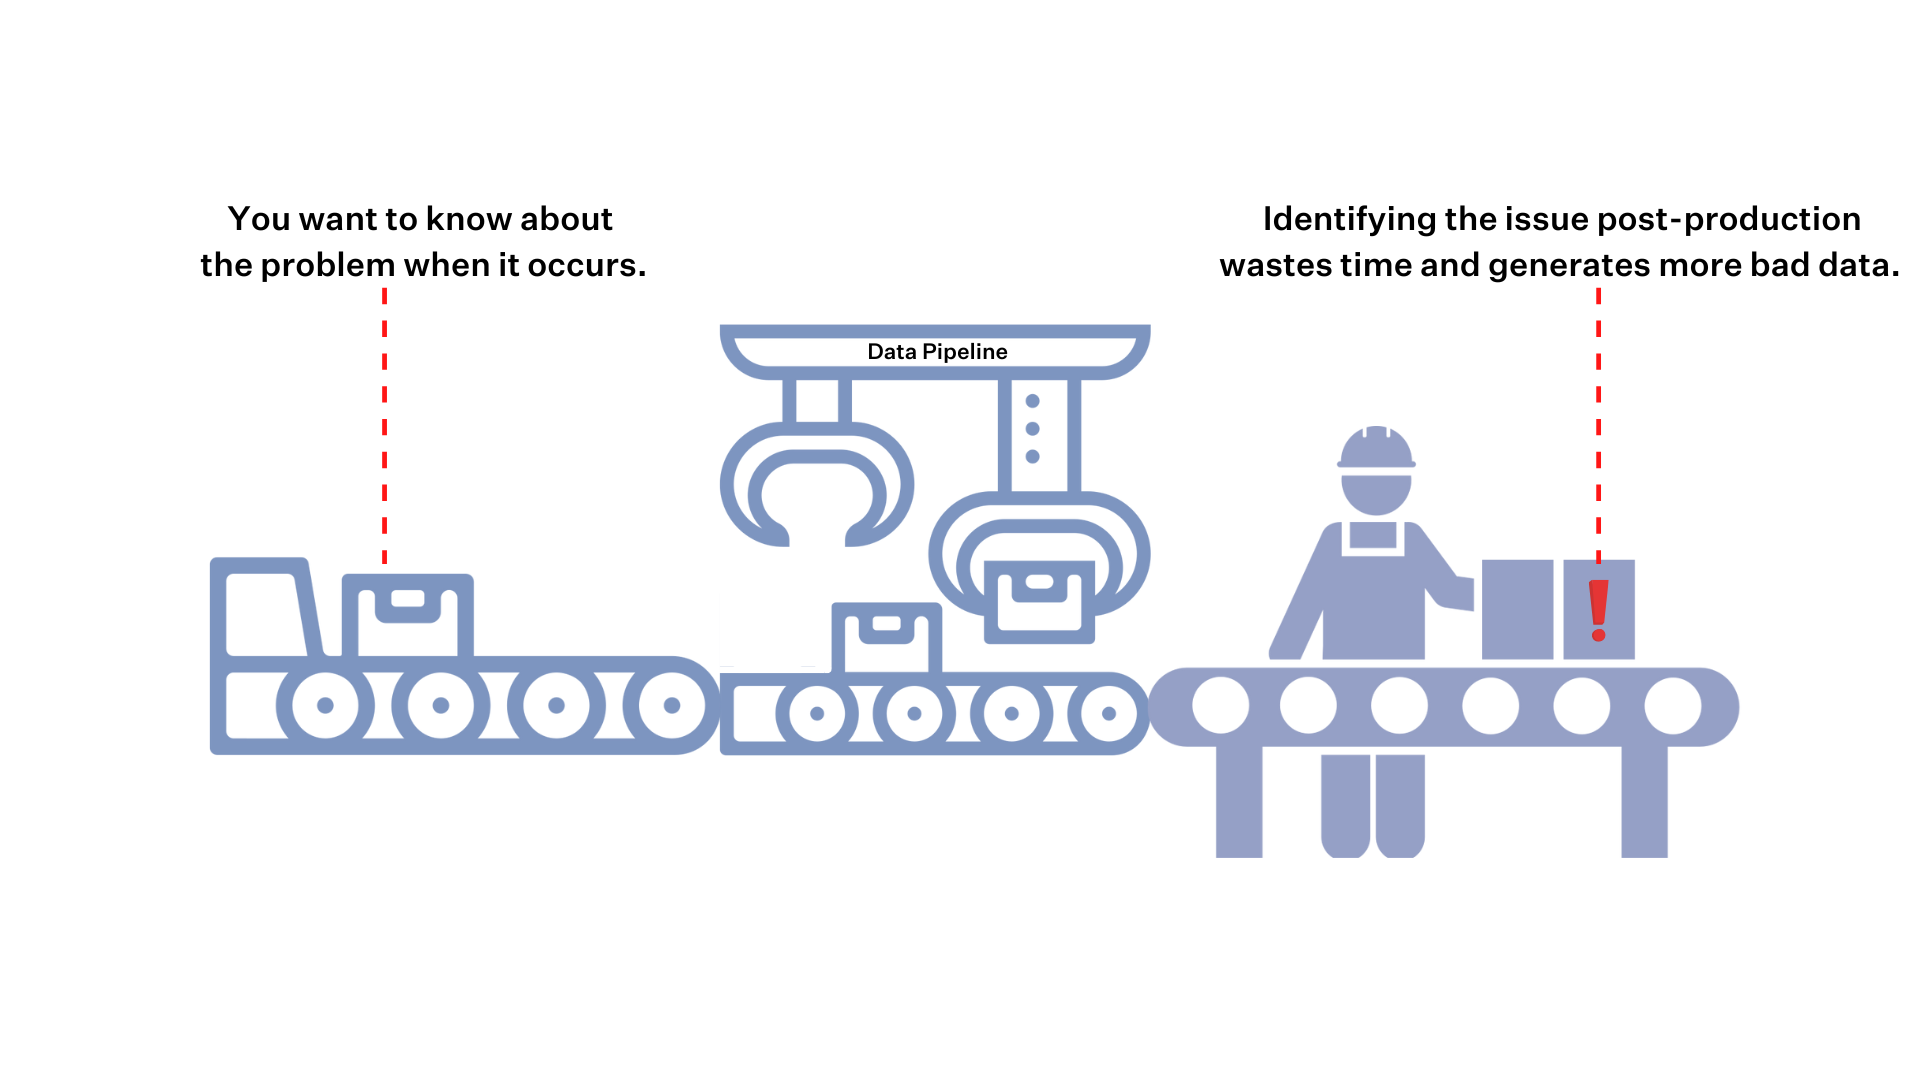
On an assembly line, Tesla doesn’t only put quality controls in place when the Model X is ready to ship to the customer. They check the battery, engine components, and the body at each step along the way.
Shouldn’t we check our data pipelines at each point of failure as well? This includes automatic analysis of the pipeline’s SQL logs to understand any recent changes in the code and logic; Airflow logs to understand failures and delays; and dbt logs to understand errors, delays and test failures.
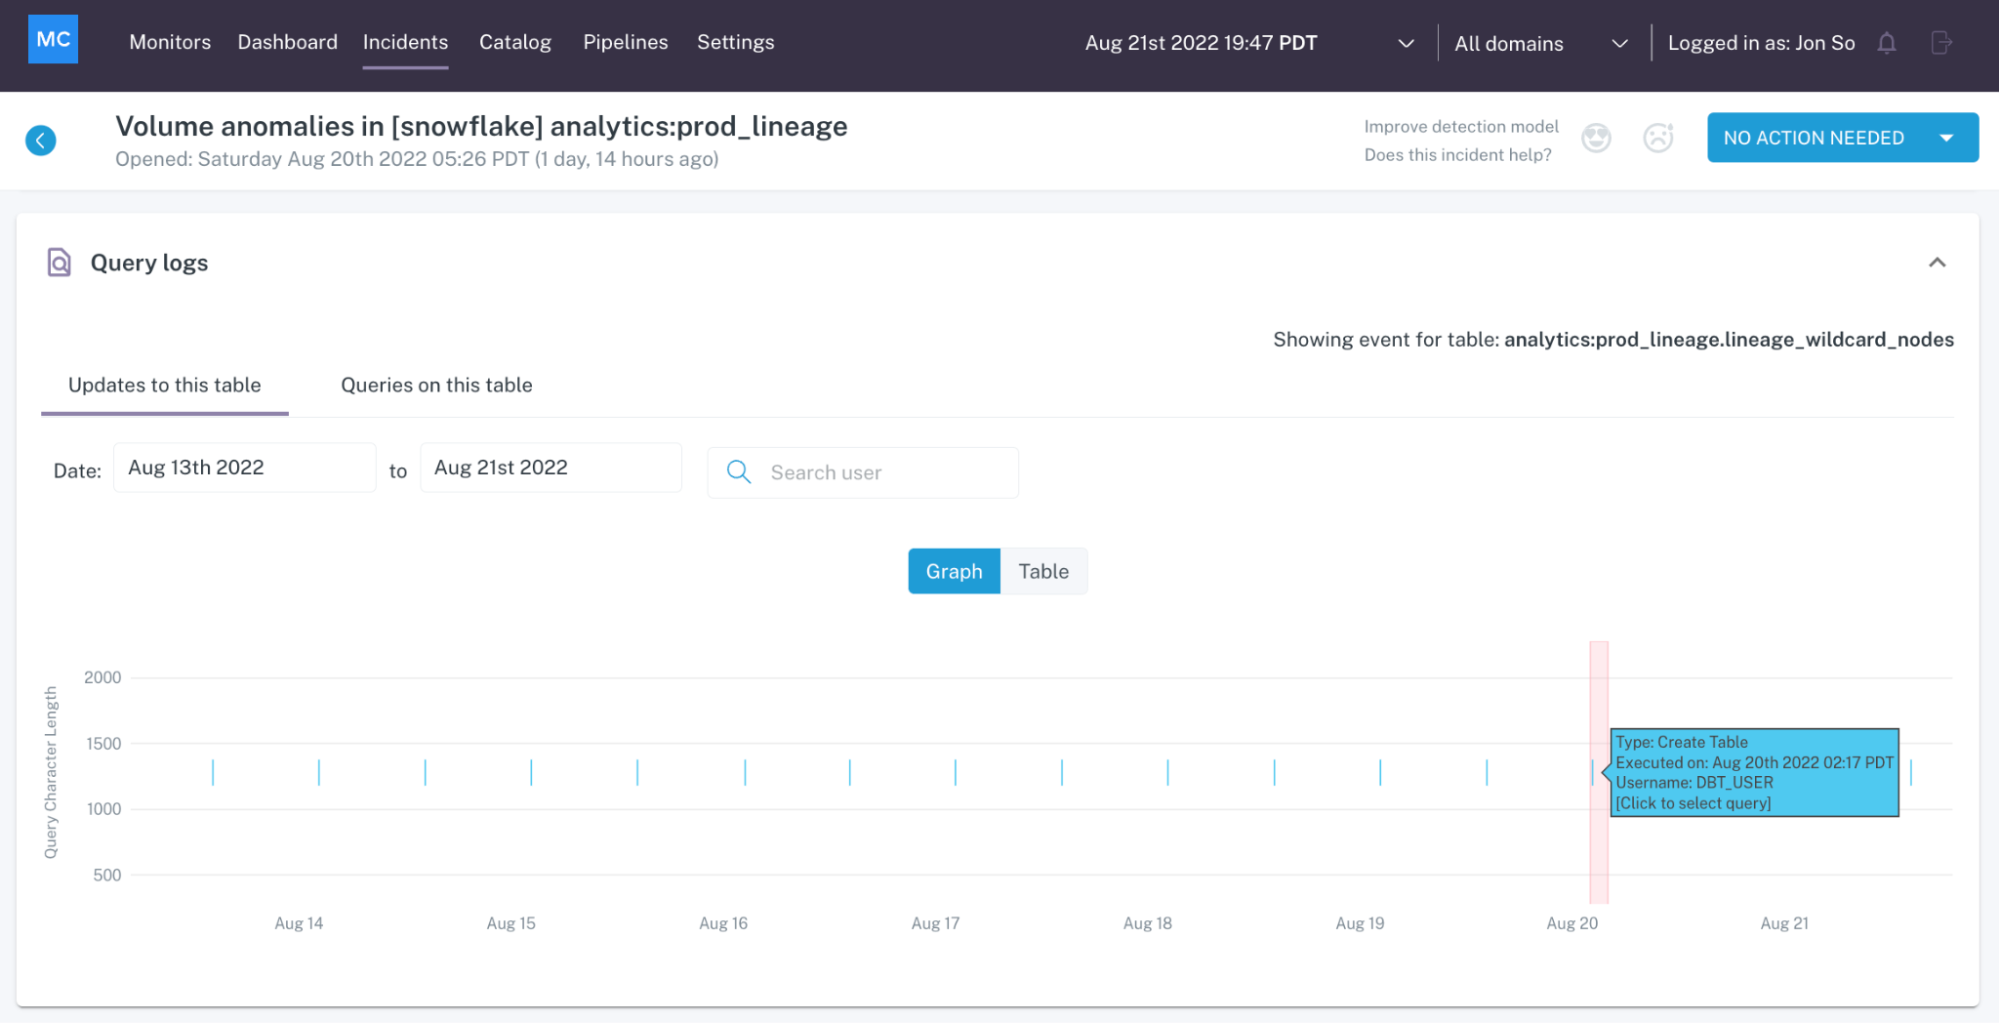
And the only way to do this cost-effectively and at scale is by analyzing logs across the stack. This approach both covers all your points of failure, and provides additional context to help you prevent future anomalies.
For example, analyzing logs at the BI layer can identify downstream users and data consumption patterns, helping you to more effectively deploy your deep monitors. Identifying logs within the enterprise data warehouse can automatically assess key components of data health such as deteriorating queries or disconnected tables.
Common data quality monitoring challenges (and how observability solves them)
Even mature teams find data quality monitoring hard to sustain as data volume, velocity, and ownership grow. Below are the most common challenges we see and how an observability-driven approach addresses them in practice.
Scale
Modern stacks contain hundreds of tables with frequent schema changes. Manually writing and maintaining checks for all of them does not scale. Observability uses metadata-level monitors to provide broad coverage by default and highlights the few assets that need deeper rules.
Unknown Unknowns
Rule-based tests only catch scenarios you can anticipate. Novel anomalies, subtle distribution shifts, and combined failures often slip through. Observability layers ML-based baselines and behavior modeling to detect unexpected patterns early.
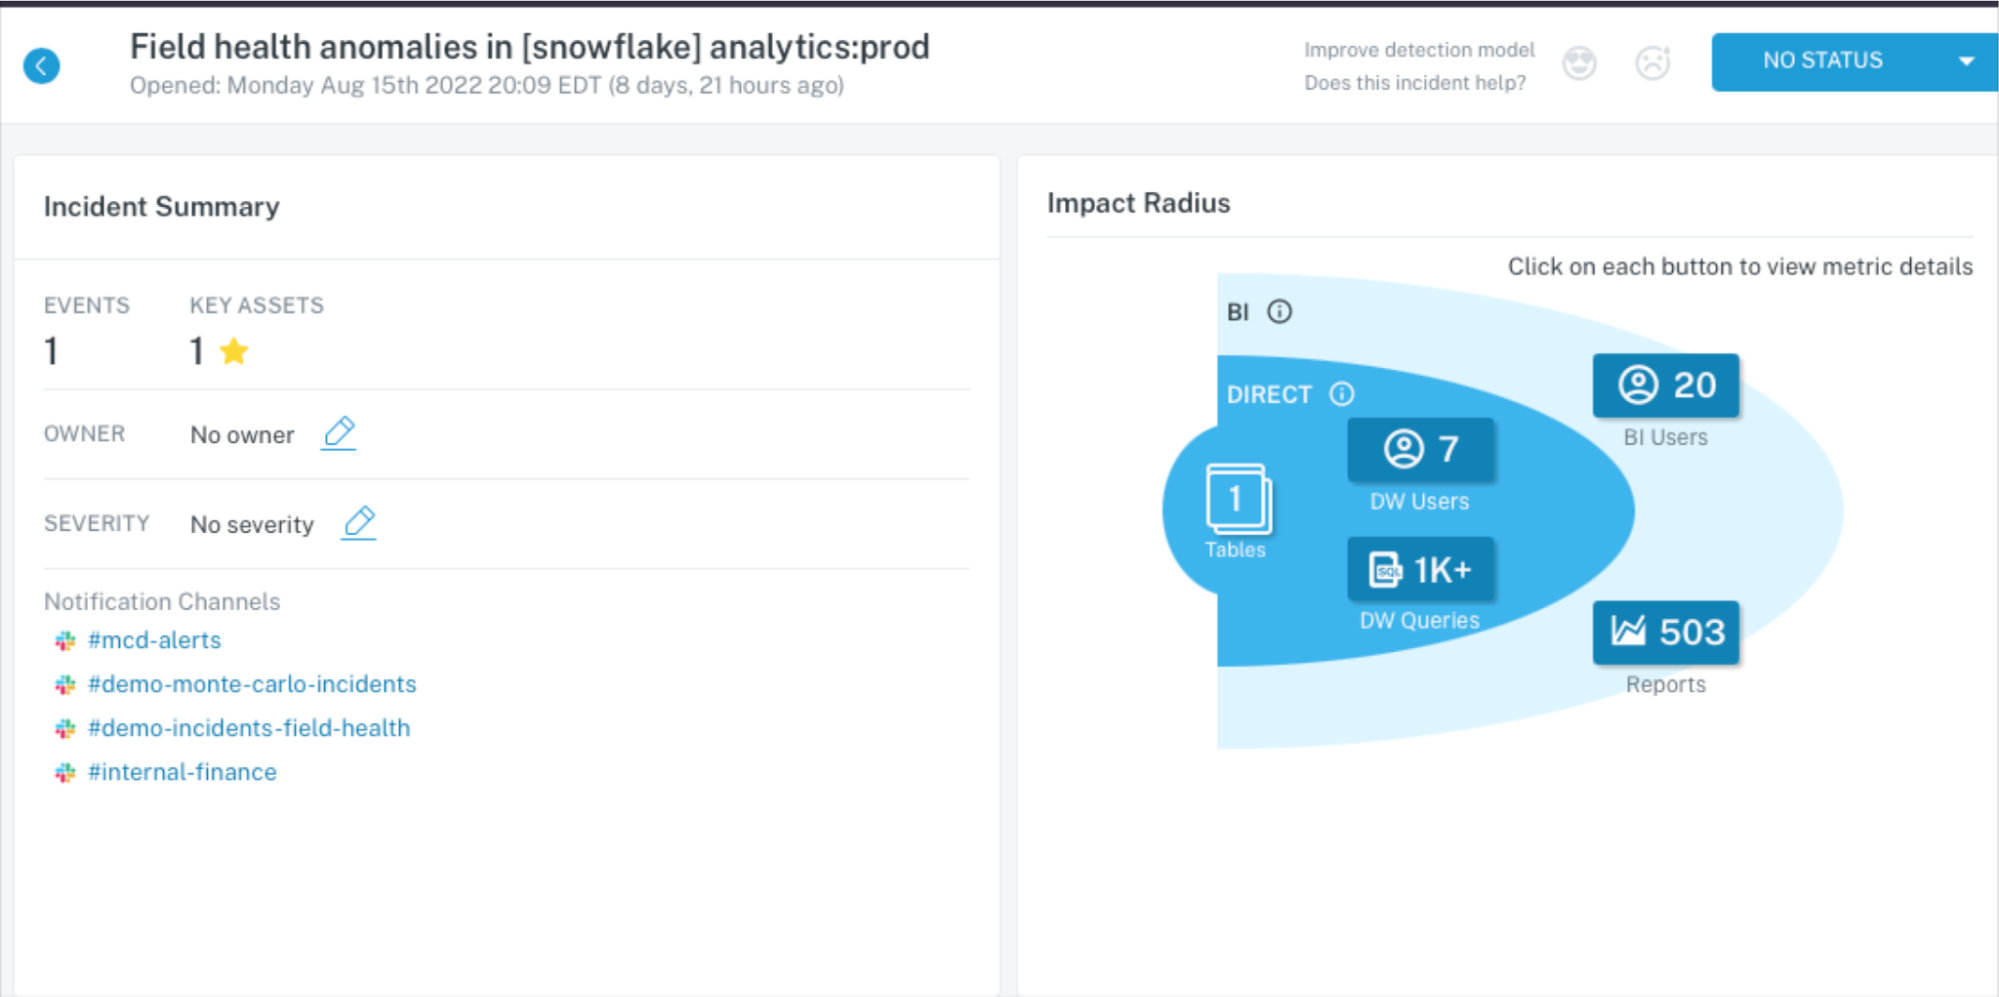
Root Cause and Ownership
Alerts often fire on downstream symptoms while the cause sits upstream in a job or source, and handoffs stall because ownership is unclear. With lineage and log correlation, observability traces the blast radius back to the change that mattered and routes incidents to the right team. This shortens investigation time and reduces back-and-forth.
Alert Fatigue
Noisy, duplicate, and low-signal alerts train teams to ignore real issues, and static thresholds break during seasonal or growth shifts. Observability groups related signals into a single incident, applies learned thresholds, and adds impact context so engineers see what truly requires action. The result is fewer alerts with higher signals.
Cost and Compute
Row-scanning checks across large tables are expensive and can slow pipelines, so teams postpone monitoring to avoid extra load. Observability favors lightweight, metadata-first monitors at scale and reserves deeper scans for gold datasets. This reduces cost while preserving meaningful coverage.
Inconsistent Definitions
Teams disagree on what “quality” means and how to measure it, which leads to fragmented policies and debates. Observability anchors on shared dimensions and KPIs, publishes them with lineage, and makes pass rates visible so everyone aligns on the same targets. Clear definitions make alerts and SLAs actionable.
Benefits of Data Quality Monitoring
Data quality monitoring pays off quickly by cutting incidents and raising confidence in data-driven work. The benefits below are what teams consistently see once they pair broad, metadata-first coverage with deeper checks on their most critical data assets.
Higher Trust
Stakeholders can rely on dashboards and ML features because core tables meet freshness and completeness SLOs. Visible pass rates and incident history build confidence and reduce ad hoc verification. As trust improves, adoption of analytics and decision velocity increase.
Faster Incident Response
Broad monitors detect issues closer to the source, which lowers mean time to detection. Lineage and log correlation point to the upstream owner and code change, which shortens investigation and resolution. Teams spend less time paging the wrong people.
Productivity
Engineers spend less time writing brittle checks and chasing false alarms. Automated baselines and incident grouping reduce manual triage, so teams can focus on shipping models, pipelines, and features. The result is more value delivered per sprint.
Risk Reduction
Proactive detection prevents bad data from reaching finance reports, customer-facing systems, and regulatory submissions. Consistent monitoring and auditable workflows lower compliance exposure and revenue leakage. Executives get earlier signals when data risk is rising.
How to Implement Data Quality Monitoring
Implementing data quality monitoring does not require a full rebuild of your data stack. The steps below walk through how to roll out coverage in a way that scales with your pipelines and focuses attention on the issues that matter most.
1) Scope & Prioritize
Inventory your domains and tables, then rank them by business criticality and potential blast radius. Start with gold‑tier assets and sources that feed many downstream products. Create a short, ordered backlog based on value × risk.
2) Turn on Broad Coverage
Enable freshness, volume/completeness, and schema monitors across all critical production schemas with a default policy. Use lightweight, metadata‑based checks to avoid heavy query cost. Aim for near‑100% table coverage in the first week.
3) Go Deep on Gold Tables
Add ML‑based monitors for distribution drift, spikes, and drops on key fields. Complement them with SQL/dbt rules for business constraints and referential integrity. Tune thresholds after an initial learning period to reduce noise.
4) Wire Alerting and Routing
Group related signals into a single incident with impact context like affected dashboards and queries. Route incidents to the upstream owner using lineage and code ownership. Deliver alerts where teams work (Slack, PagerDuty) and include runbook links.
5) Close The Loop
Ingest logs from the warehouse, orchestrator, transformation layer, BI, and data movement systems into the incident timeline. Correlate anomalies with code releases, job failures, and schema changes to accelerate root cause analysis. Record fixes so they can be automated next time.
6) Measure and Improve
Track coverage, MTTD, MTTR, freshness pass rate, and incident counts by domain. Review the noisiest monitors weekly and either tighten logic or retire them. Use trend data to target engineering work that eliminates recurring root causes.
What to Look for in a Data Quality Monitoring Solution
When evaluating data monitoring tools, look for a combination of broad coverage, targeted precision, and seamless integration with your existing workflows. The most effective solutions balance deep insights with ease of use, while supporting the scale and governance needs of modern data teams. Below are the core capabilities to prioritize.
Breadth and Depth
Start with coverage. A strong monitoring solution should provide table-level observability across your entire schema, including freshness, volume, and schema changes. But broad coverage alone is not enough. You also need the ability to apply targeted, column-level checks where it matters most. The best platforms let you combine lightweight, automated monitors with deeper checks for your most critical assets, all without adding operational overhead.
Lineage-Aware Root Cause and Impact Analysis
Monitoring works best when it understands your data’s context. Tools with built-in data lineage can trace issues upstream to their source and downstream to affected dashboards, reports, and models. This visibility makes it easier to identify root causes, assess impact, and resolve issues quickly. It also helps teams avoid duplicate work by clarifying ownership across the data stack.
Self-Serve and Scalable
Monitoring tools should be easy to set up and able to grow with your data. Look for platforms that offer no-code configuration, default policies you can turn on in minutes, and flexible deployment for large numbers of assets. Ideally, you should be able to cover most of your environment with a few clicks, while still supporting more granular setups for high-cardinality tables and partitioned datasets.
Automation and Machine Learning
Effective monitoring should not require constant tuning. Modern platforms use machine learning to learn expected patterns from historical data, automatically adjust thresholds, and recommend new monitors when anomalies emerge. These features reduce manual upkeep and help your team focus on real issues rather than noise.
APIs and Monitors as Code
Monitoring should be part of your development workflow. Platforms that support monitors as code let you define checks in YAML, integrate them with dbt models, and manage everything through version control. APIs and command-line tools make it possible to deploy and update monitors through your CI/CD pipeline, keeping configuration consistent across teams and environments.
Governance and Privacy
Security and compliance are essential, especially when working with sensitive or regulated data. Look for platforms with enterprise-grade access controls, detailed audit logs, and support for SSO and SCIM. You should also have options to redact or exclude personally identifiable information from logs to ensure privacy and compliance with internal policies.
There are many data monitoring tools on the market, but only a few deliver across every category listed above. Monte Carlo is one of them. It combines broad and automated coverage with deep incident context, code-first workflows, and strong enterprise controls, making it a dependable choice for teams that need reliable and scalable data observability.
Going further with AI-powered monitoring and resolution
Your team’s productivity will always be determined by its most manual processes. And for several years now, one of the most time-consuming (and often value-neutral) processes has been data quality.
Solutions like data observability abstracted much of that away in the early 2020 with the advent of automated monitoring; thoughtful ownership protocols that allowed teams to manage business rules by data products; and resolution insights that empowered teams to know what happened, why, and how to resolve it quickly. And the results spoke for themselves. Teams leveraging data observability were seeing hundreds of hours saved on previously manual work that could be re-allocated to adding new value.
Then in 2023, when AI began leveling workflows with simple prompt and response interactions, the door opened to bring AI to the data quality equation.
Built on the back of Monte Carlo’s data observability solution and powered by years of context detecting and resolving enterprise data issues at scale, our observability agents super power monitor creation and incident resolution to help teams accelerate their data quality practice and improve the health of data and AI products at scale.
Observability agents
Monitoring Agent collapses the process of defining new business rules by recommending new monitors and thresholds, and enables anyone to deploy a new monitor with the push of a button.
But it’s not enough to know what broke. You also need to know how to fix it: and our new Troubleshooting Agent is designed to do just that. Troubleshooting Agent brings our resolution insights along with years of incident resolution to bear on your pipelines to investigate, verify, and explain the root cause of specific data quality issues along with the recommended next steps to resolving them fast.
These agents are the first of their kind, not just making simplistic recommendations based on data profiles, but leveraging a sophisticated network of LLMs, native integrations and subagents to gain full visibility into the data estate across data, systems, transformation code, and model outputs.
“AI agents are only as powerful as they are informed,” said Lior Gavish, co-founder and CTO, Monte Carlo. “Our AI agents can execute more sophisticated analyses that are truly useful because they are reviewing data samples to determine what the data looks like, metadata to understand the larger contextual meaning, and query logs to understand how the data is used.”
The future of data quality monitoring is end-to-end data + AI observability
At the end of the day (or rather, the end of the pipeline), pairing deep data quality monitoring with broad coverage gives you the best of both worlds is the only approach that delivers end-to-end visibility—for both your known and unknown issues. But if your goal is truly enterprise trust, broad or deep monitoring aren’t enough on their own.
You need a comprehensive data quality monitoring strategy, combined with thoughtful automation and AI tooling to not only scale coverage, but also understand the issues and get the right insights to resolve them quickly.
And if you’re building your own AI agents, Monte Carlo extends that coverage into your model layer as well with production-ready AI observability to provide the same end-to-end visibility for all your data and AI products—no matter how complex the systems and outputs are.
It’s time to move beyond traditional data quality and embrace a solution that enables you to not only detect a few narrow issues in a silo, but resolve any issue at scale. That’s data + AI observability.
Interested in learning more? Reach out to Lior, Bryce, and the rest of the Monte Carlo team.
Our promise: we will show you the product.


