The Data Engineer’s Guide To Root Cause Analysis for Data Quality Issues

Table of Contents
Guess how long it takes to resolve a data quality issue or anomaly. Ready?
According to our survey of more than 200 data professionals, it’s a shocking 19 hours. The vast majority of that time is spent trying to figure out the root cause. In other words, WHY did this break or anomaly occur?
Here’s another stat for you. Based on our own telemetry from monitoring more than 10 million tables, we find data + AI teams are troubleshooting 1 meaningful incident a year for every 15 table in their environment.
Sure, this takes up a lot of the teams time, but even worse, this level of business disruption costs millions. Literally millions for the average enterprise organization according to Forrester.
But with a disciplined, systemic approach much of this downtime can be reduced whether or not you are leveraging a data + AI observability solution.
So read on to learn how the best data engineers on the best dataops and incident response teams approach root cause analysis. We’ll walk through a seven step approach to make this process faster, a little less painless, and much more efficient the next time this happens to you.
Table of Contents
What makes a successful root cause analysis?
When data downtime strikes, the first step (well, after pausing your pipeline) is to identify what broke.
In theory, root causing sounds as easy as running a few SQL queries to segment the data, but in practice, this process can be quite challenging. Incidents can manifest in non-obvious ways across an entire pipeline and impact multiple, sometimes hundreds, of tables.
For instance, one common cause of data downtime is freshness – i.e. when data is unusually out-of-date. Such an incident can be a result of any number of causes, including a job stuck in a queue, a time out, a partner that did not deliver its dataset timely, an error, or an accidental scheduling change that removed jobs from your DAG.
In my experience, I’ve found that most data problems can be attributed to one or more of these events:
- An unexpected change in the data feeding into the job, pipeline or system
- A system operational issue, such as runtime errors, permission issues, infrastructure failures, schedule changes, etc.
- A change in the query code or logic (ETL, SQL, Spark jobs, etc.) transforming the data
To make this even more fun, were now seeing data quality incidents being introduced by non-deterministic AI models. We’ve worked with data + AI teams that have seen models estimate a custome was 120% satisfied on a support call for instance.
Quickly pinpointing the issue at hand requires not just the proper tooling (more on that later), but a holistic approach that takes into consideration how and why each of these three sources could break.
So if you are going to do this manually, here’s what you do.
Step 1. Determine if you care
I’m not even being (that) tongue in cheek. There are more data anomalies then there are data engineers. Before you launch your odyssey, determine the blast radius of the incident. If the only thing downstream is a deprecated dashboard then you are likely off the hook.
If this occurs on one of your key assets populating 36 dashboards downstream, then you better hop on it before the angry Slacks start rolling in.
Step 2. Look at your past incident documentation
Unfortuantely, I realize this is wistful thinking for many. However, history tends to repeat itself particularly when it comes to data quality incidents.
If last time your sales fact table stopped getting data because of a Salesforce schema change, that is probably a good place to start for the next freshness anomaly. If your team isn’t conducting post-mortems and documenting incidents, be the change you want to see in the world.
Step 3. Look at your data lineage
You know the sales dashboard is broken. You also know this dashboard is built on top of a long chain of transformations, feeding off of several (or maybe several dozen…) data sources.
To understand what’s broken, you will need to find the most upstream nodes of your system that exhibit the issue aka the point of origin. This is where our tragic story beings and it’s where the answer lies. If you’re lucky, the root of all evil is only a few tables upstream and you will identify the problem relatively quickly.
Are you usually that lucky? Me neither.
More often than not, the problem happened in one of the most upstream sources of your system, many transformation steps away from the broken dashboard. You now have a long day of tracing the issue up the DAG, and then backfilling all broken data.
In his upcoming O’Reilly book on data contracts, Chad Sanderson calls this the fan-out problem. I call it a bad day.
Takeaways. Make sure everyone (data engineers, data analysts, analytics engineers, and data scientists) troubleshooting data problems have access to the most up-to-date lineage. Your data lineage should be cross-system including BI reports, DAGs, transformation models, etc to be useful. If you have an overlay of recent data incidents it’s even easier to follow the yellow brick road to the incident point of origin.
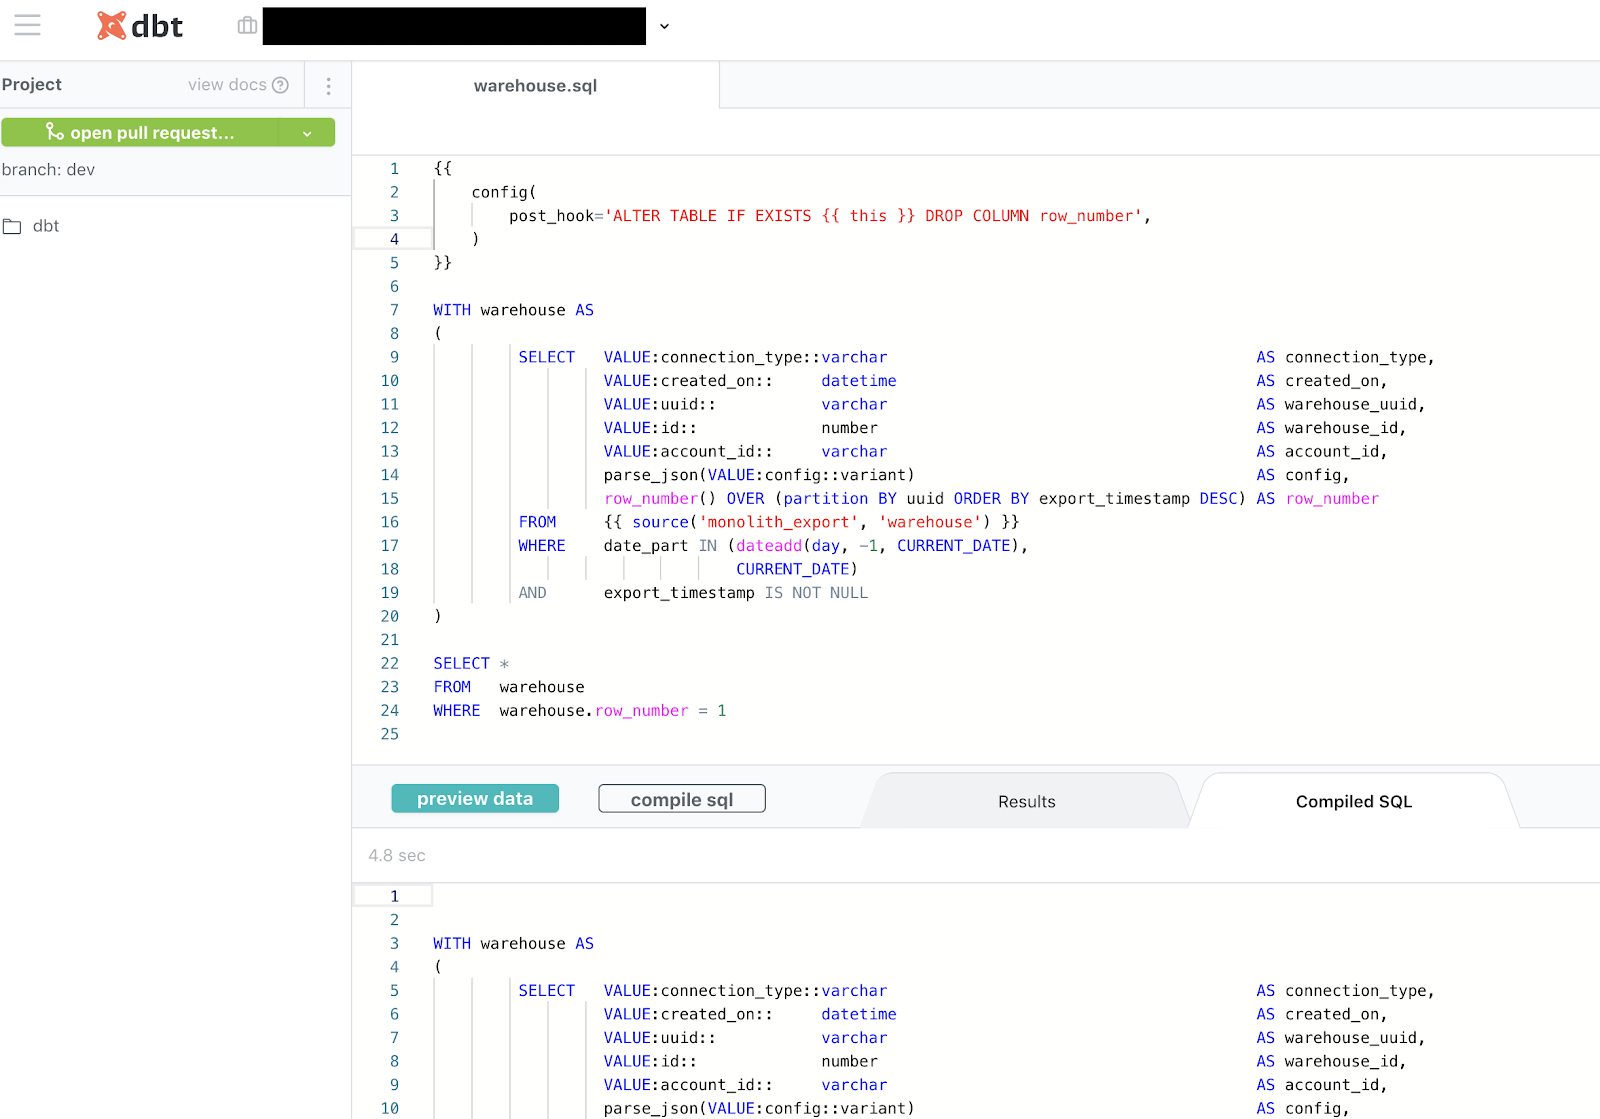
Step 4. Look at the query code
You found the most upstream table that’s experiencing the issue. Congratulations, you’re one step closer to understanding the root cause. Now, you need to understand how that particular table was generated by your ETL processes.
A peek into the logic that created the table, or even the particular field or fields that are impacting the incident, will help you come up with plausible hypotheses about what’s wrong. Ask yourself:
- Were any pull requests made right before the incident occurred? What about upstream?
- What code most recently updated the table? And when?
- How are the relevant fields calculated? What could possibly have created the “wrong” data given this logic?
- Have there been any recent changes to the logic, potentially introducing an issue?
- Have there been any ad hoc writes to the table? Has it been backfilled recently?
Takeaways. Make sure everyone troubleshooting data problems can quickly trace back tables to the logic that created them. To get to the bottom of things, you need to know not only what the code currently looks like, but also what it looked like when the table was last updated and ideally when that happened. While we all try to avoid them, backfills and ad hoc writes should be accounted for.
Step 5. Look at your data
You now know how the data was calculated and how that might have contributed to the incident. If you still haven’t spotted the root cause, it’s time to look at the data in the table more closely for hints of what might be wrong.
Ask yourself:
- Is the data wrong for all records? For some records?
- Is the data wrong for a particular time period?
- Is the data wrong for a particular subset or segment of the data, e.g. only your android users or only orders from France?
- Are there new segments of the data (that your code doesn’t account for yet…) or missing segments (that your code relies on…)?
- Has the schema changed recently in a way that might explain the problem?
- Have your numbers changed from dollars to cents? Your timestamps from PST to EST?
And the list goes on.
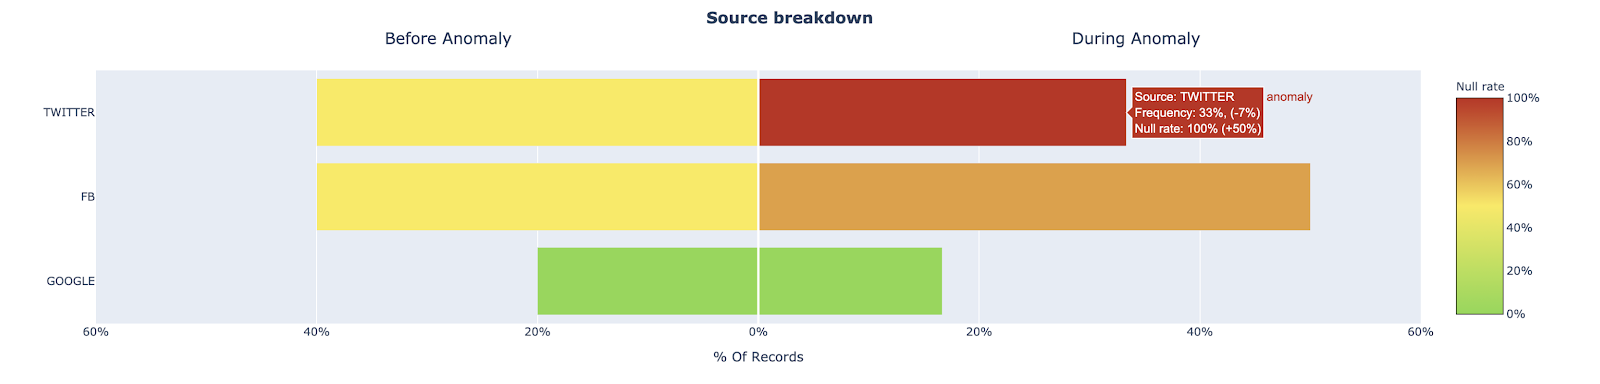
One promising approach here is to explore how other fields in a table with anomalous records may provide clues as to where the data anomaly is occurring. For example, one data + AI team surfaced that an important Users table for one of our customers experienced a jump in the null rate for the user_interests field. We looked at the source field (Twitter, FB, Google) to see if a relational pattern could point us in the right direction.
This type of analysis provides two key insights, both of which would explain the increase of null records, but ultimately drive very different actions.
- The proportion of records associated with source=”Twitter” increased significantly, which normally has more records where user_interests=”null” than other sources
- The proportion of records where user_interests=”null” increased for records with source=”Twitter”, while the proportion of records with source=”Twitter” did not change
For insight 1, we may just be experiencing a seasonality issue or the result of an effective marketing campaign. For insight 2, we likely have a data processing issue with user data coming from our Twitter source and can focus our investigation on the data coming from Twitter
Takeaways. Make sure everyone troubleshooting data problems can handily slice and dice data to find how the issue correlates with various segments, time periods and other cuts of the data. Visibility into recent changes to the data or its schema is a lifesaver. Keep in mind that while these statistical approaches are helpful, they are just one piece of the larger RCA process.
Step 4. Look at your system operational environment
Okay, the data checks out. What now? Many data issues are a direct result of system or ELT job failures. In other words, check out if there are any issues with the systems moving or transforming your data.
A look at logs and error traces from your ETL engines can help answer some of the following questions:
- Have relevant jobs had any errors?
- Were there unusual delays in starting jobs?
- Have any long running queries or low performing jobs caused delays?
- Have there been any permissions, networking or infrastructure issues impacting execution? Have there been any changes made to these recently?
- Have there been any changes to the job schedule to accidentally drop a job or misplace it in the dependency tree?
For complex pipelines this can get messy. There are likely multiple systems firing off multiple failure alerts every day. Consolidating signals across your environment and understanding which jobs are related to which tables is a massive step in the right direction.
Takeaways. Make sure everyone troubleshooting data problems understands how ETL jobs are performed and have access to the relevant logs and scheduling configuration. Understanding infrastructure, security and networking can help as well.
Step 6. Leverage your peers
You did everything you can (or maybe you’re looking for shortcuts) – what’s next? You need to get guidance from your data team. Before you start bombarding Slack with questions, ask yourself:
- Who owns the dataset that’s experiencing the issue right now? Who can I reach out to for more context?
- Who uses the dataset that’s experiencing the issue right now? Who can I reach out to for more context?
Takeaways. Make sure everyone troubleshooting data problems have access to metadata about dataset ownership and usage, so they know who to ask.
Want to Automate This?
As fun as it is to be the hero, our backlogs aren’t getting any smaller. There are datasets to onboard and data products to build.
Data + AI platforms like Monte Carlo can reduce the root cause analysis process by 80% or more. We first detect the issue with our data quality monitors and then leverage the signals across your environment (ELT system/pipeline metadata, query logs, data tables, etc) to automatically correlate it to the root cause and explain WHY it happened.
In fact, we just released our Troubleshooting Agent which goes through much of the root cause analysis process listed above and returns the root cause automatically in a matter of minutes. Check out the 90 second video below to learn more.
Interested in learning more about how to conduct RCA on your data pipelines? Book a time to speak with us using the form below.
Our promise: we will show you the product.


